

Solving the 8kSec FridaInTheMiddle iOS reverse engineering CTF
I've been spending a lot of time with Frida for mobile app hacking lately. But sometimes you just can't beat the benefits of the native debugger. For the 8kSec "FridaInTheMiddle" challenge I decided to put Frida aside and tackle it using LLDB alone. While frida-server was running on the device and triggering the app anti-debugging check to close the app when Frida was detected, I've been working with LLDB a lot lately and wanted to use it for the whole process instead of starting in LLDB and finishing with Frida.
Here is the walkthrough of how I reversed the app, bypassed the anti-debug checks, and extracted the flag from memory.
Challenge Description
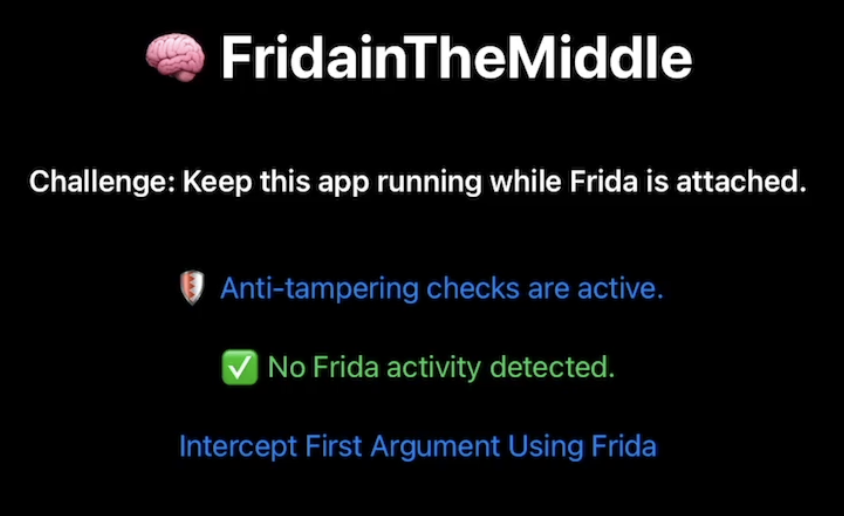
Welcome to FridaInTheMiddle, a Swift-based iOS application that’s extremely sensitive to uninvited interference. It comes equipped with active runtime tamper detection that watches for signs of Frida, whether through suspicious ports, injected dylibs, or unauthorized hooks.
Your mission:
Keep the app running while Frida is attached, and intercept the argument passed to dummyFunction(flag:) to extract the flag.
The App
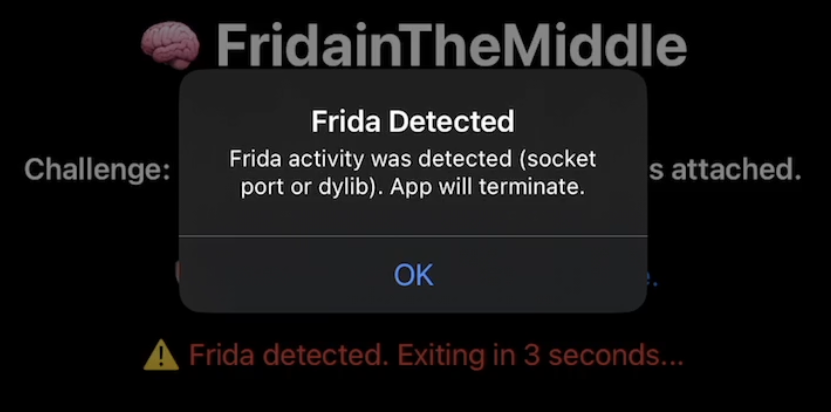
The challenge has anti-debug logic that runs immediately on launch. If the Frida server is running on the default port (27042/TCP), the app alerts and closes within 5 seconds.
You can't bypass this in Frida because it can't set native debug breakpoints. To get around this, I launched the binary directly using debugserver on the device. This starts the process but pauses it at the very first instruction, effectively freezing time before the app can run its detection checks.
The Setup
First things first, I needed to run debugserver on the device and start the app. Debugging over Wi-Fi is too slow, so I established a USB tunnel using iproxy.
Terminal 1 (iproxy):
iproxy 1234 1234Terminal 2 (debugserver):
SSH into the iPhone/iPad device and start debugserver:
debugserver 0.0.0.0:1234 --waitfor FridaInTheMiddleIf you're not familiar with debugserver, it's a debugging stub that you run on the device and remote debugger clients (LLDB) connect to it. You can get it from Xcode on macOS, or install it through your iOS device package manager (Sileo). It's much easier to install it through the jailbreak package manager.
Then I tapped to start the app on the device. With the app frozen, I connected my debugger.
Terminal 3 (LLDB):
lldb
(lldb) platform select remote-ios
(lldb) process connect connect://127.0.0.1:1234
Phase 1: Bypassing the "Sanity Check"
The app was paused, but I knew that as soon as I hit "continue" in LLDB it would run a check and crash. I needed to find that check. An alternative to disassemblers such as Hopper or Ghidra for listing symbols is to run the following commands in LLDB:
(lldb) command regex userlibs 's#^$#script for m in lldb.target.module_iter(): print(m.file) if "/var/" in str(m.file) else None#'
(lldb) userlibs
/private/var/containers/Bundle/Application/94DE3BE4-C4EB-4E25-9EC3-90C0149BFC33/FridaInTheMiddle.app/FridaInTheMiddle
/private/var/containers/Bundle/Application/94DE3BE4-C4EB-4E25-9EC3-90C0149BFC33/FridaInTheMiddle.app/FridaInTheMiddle.debug.dylib
The userlibs command alias limits the modules shown to only those from the application and filters out any system modules for ease of reading. Otherwise you'd have hundreds of useless lines of output to read. Then you can use the list of modules enumerated from the userlibs command to enumerate all symbols in each module: (lldb) image dump symtab FridaInTheMiddle.debug.dylib. I searched for keywords like "Check", "Debug", or "Sanity".
My analysis revealed a symbol named FridaInTheMiddle.systemSanityCheck which returns a boolean value:
(lldb) image lookup -rn "Sanity" FridaInTheMiddle.debug.dylib
1 match found in /private/var/containers/Bundle/Application/94DE3BE4-C4EB-4E25-9EC3-90C0149BFC33/FridaInTheMiddle.app/FridaInTheMiddle.debug.dylib:
        Address: FridaInTheMiddle.debug.dylib[0x0000000000008bfc] (FridaInTheMiddle.debug.dylib.__TEXT.__text + 19452)
        Summary: FridaInTheMiddle.debug.dylib`FridaInTheMiddle.systemSanityCheck() -> Swift.Bool
Back in LLDB, I set a breakpoint on that symbol:
(lldb) b FridaInTheMiddle.systemSanityCheckI resumed the app (c), and it soon hit the breakpoint. I used the finish command to allow the function to continue and pause when the function returned, and then I manually overwrote the return value.
# Run until the function finishes
(lldb) finish

# Overwrite the return register (x0) with 0 (False)
(lldb) reg write x0 0

# Resume
(lldb) c
Bypass complete!
Phase 2: Hunting the Flag
This is the part that I think was intended to be solved with Frida once you had successfully bypassed Frida detection in a debugger but I wanted to continue using LLDB. The UI presented a button labeled "Intercept First Argument Using Frida". My goal was to find the function triggered by this button and inspect its data. If you remember from the challenge description, it said intercept the argument passed to dummyFunction(flag:) to extract the flag.
You can find FridaInTheMiddle.ContentView.dummyFunction in LLDB and see that it returns a Swift String:
(lldb) image lookup -rn "dummyFunction" FridaInTheMiddle.debug.dylib
1 match found in /private/var/containers/Bundle/Application/94DE3BE4-C4EB-4E25-9EC3-90C0149BFC33/FridaInTheMiddle.app/FridaInTheMiddle.debug.dylib:
        Address: FridaInTheMiddle.debug.dylib[0x0000000000005d24] (FridaInTheMiddle.debug.dylib.__TEXT.__text + 7460)
        Summary: FridaInTheMiddle.debug.dylib`FridaInTheMiddle.ContentView.dummyFunction(flag: Swift.String) -> ()
I set a breakpoint on it in LLDB to verify it was the right target.
(lldb) b FridaInTheMiddle.ContentView.dummyFunctionI tapped the button on the device and hit the breakpoint.
Phase 3: Decoding the Swift String
Now came the tricky part: reading the data. In the Swift ABI on ARM64, string arguments are typically passed in registers x0 and x1.
- x0: Usually holds metadata or a bridge object.
- x1: Holds the pointer to the string data.
I inspected registers x0 and x1:
(lldb) reg read x0 x1
      x0 = 0xd00000000000001f
      x1 = 0x80000001027896c0 (0x00000001027896c0) "ected. Exiting in 3 seconds..."
That's not the flag we're looking for. Swift strings are a somewhat difficult topic to understand in a debugger. Swift small and large strings are stored differently in registers. I expected to see the flag in x1. I've seen a reference to Swift large strings being stored at the memory address referenced by a pointer in the x1 register, after 32 bytes of metadata.
I added 32 bytes to the pointer in x1 and got the flag!
(lldb) x/s $x1+32
0x1027896e0: "CTF{you_evaded_frida_detection}"
There it was: CTF{you_evaded_frida_detection}
Conclusion
This challenge was intended to be solved through a combination of LLDB and Frida. However, I put the most amount of effort into bypassing Frida detection which required pausing the app with a debugger, which Frida is unable to do. Since I had already done the most difficult part in LLDB I figured I may as well continue on to the next step and use LLDB to get the flag instead of putting in the extra effort to write a Frida script.